Node Differencing
The Node Groups drop-down menu on the Monitored tab (
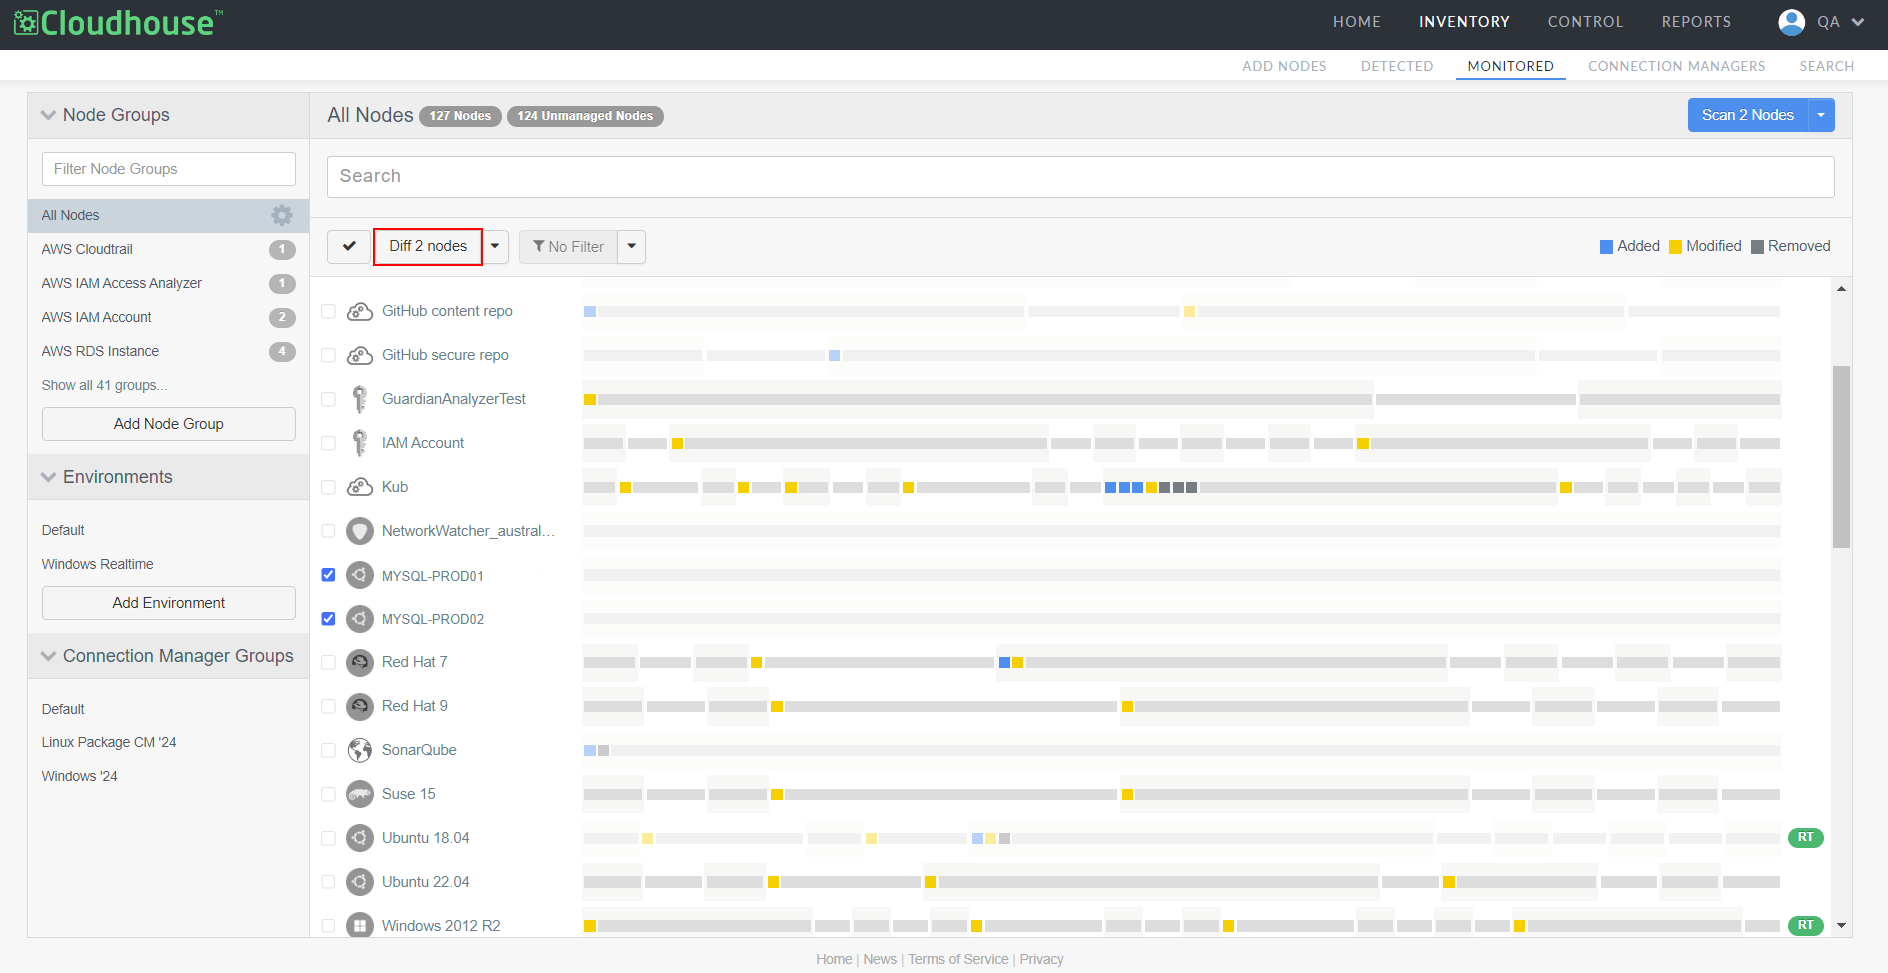
To generate a difference report for two nodes, complete the following steps:
-
In the Node Groups drop-down menu, select the checkboxes of the two nodes that you want to compare from the 'All Nodes' node group.
- Then, click to Diff 2 nodes. The difference report for the selected nodes is automatically displayed.
Note: If you select more than two nodes, the process defaults to a Group Diff in order to process the amount of configuration data present, see Group Differencing for more information.
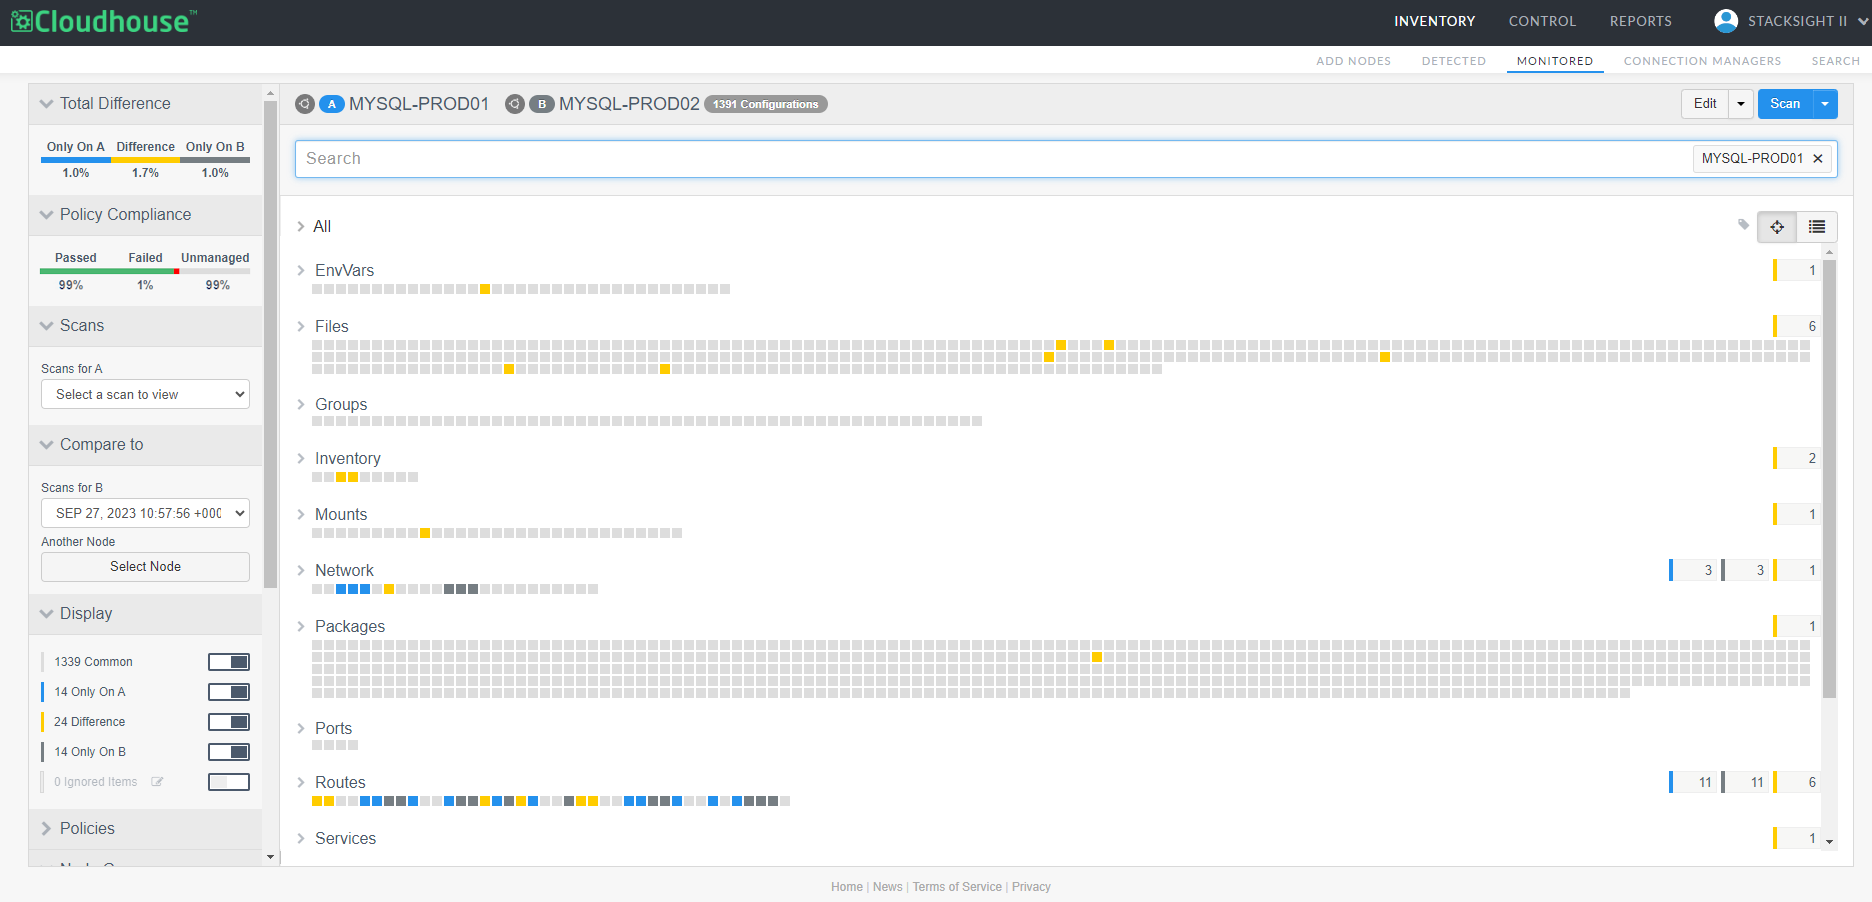
In the example below 'MYSQL-PROD01' and 'MYSQL-PROD02' have been selected for differencing. Here, you can configure the scan results for the two nodes to access the data required.
Note: Additionally, the Edit and Scan buttons are displayed here. For more information on either process, see Edit Node and Scan Nodes.
Total Difference
The configuration items for each of the selected nodes are divided into three categories within the Total Difference drop-down menu:
-
Only On A (Blue) – Configuration items that are only present on node A (the first node that was selected).
-
Difference (Yellow) – Configuration items that are present on both nodes, but have different attributes.
-
Only on B (Dark Grey) – Configuration items that are present only on node B (the second node that was selected).
Note: There is an additional category, Common, that is not included within this section as it denotes a configuration item that is present on both nodes, with no differences. To filter your display according to common or uncommon configuration items, see Display for more information.
Each configuration item is represented by a square. Each square is assigned a color depending on the category it is assigned, as described above. To view more information about a configuration item's differences between each node, select one of the colored squares in the difference report. Once selected, a side panel is displayed with the name of the configuration item, each attribute within that configuration setting, and then the differences between each attribute, if present.
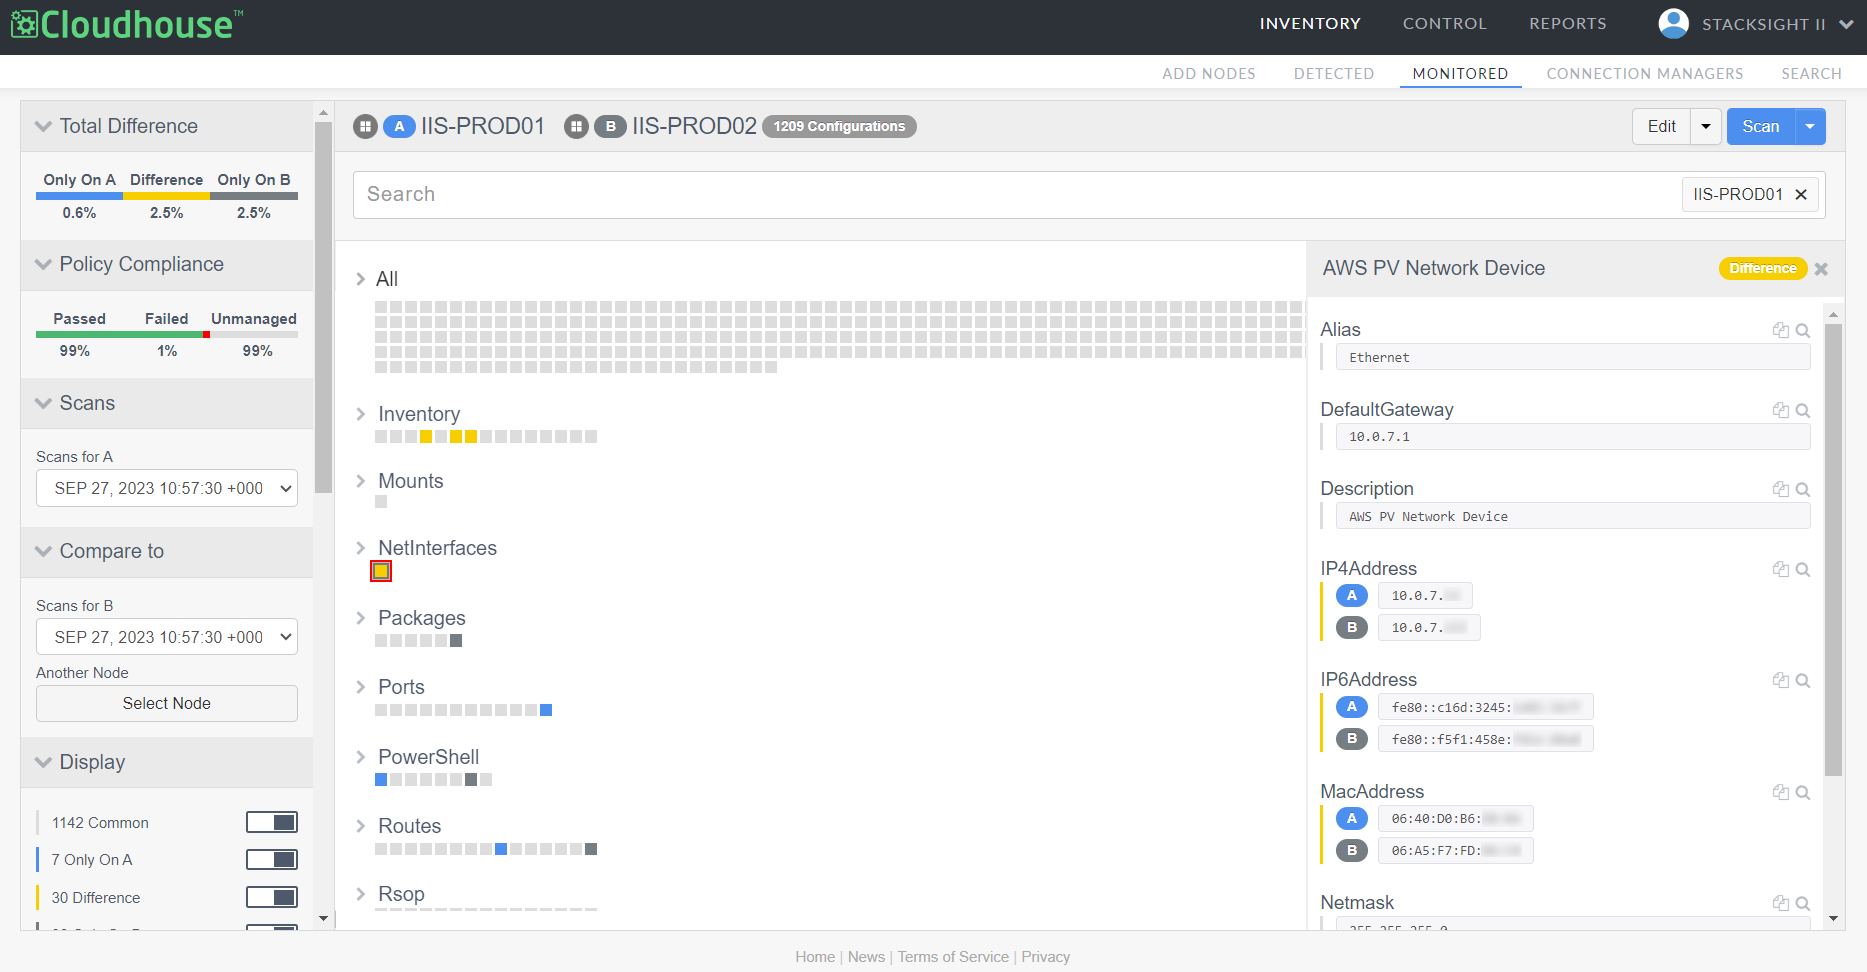
In the example above, we can see the results of the NetInterfaces configuration item, 'AWS PV Network Device'. Although the configuration item is present on both nodes, the IP4 Address, IP6Address, and MacAddress values are different. As a result, the configuration item is displayed in yellow, falling within the Difference category. Here, you can see the different IP addresses for each node, highlighted as 'A' and 'B', for the first and second selected nodes, respectively.
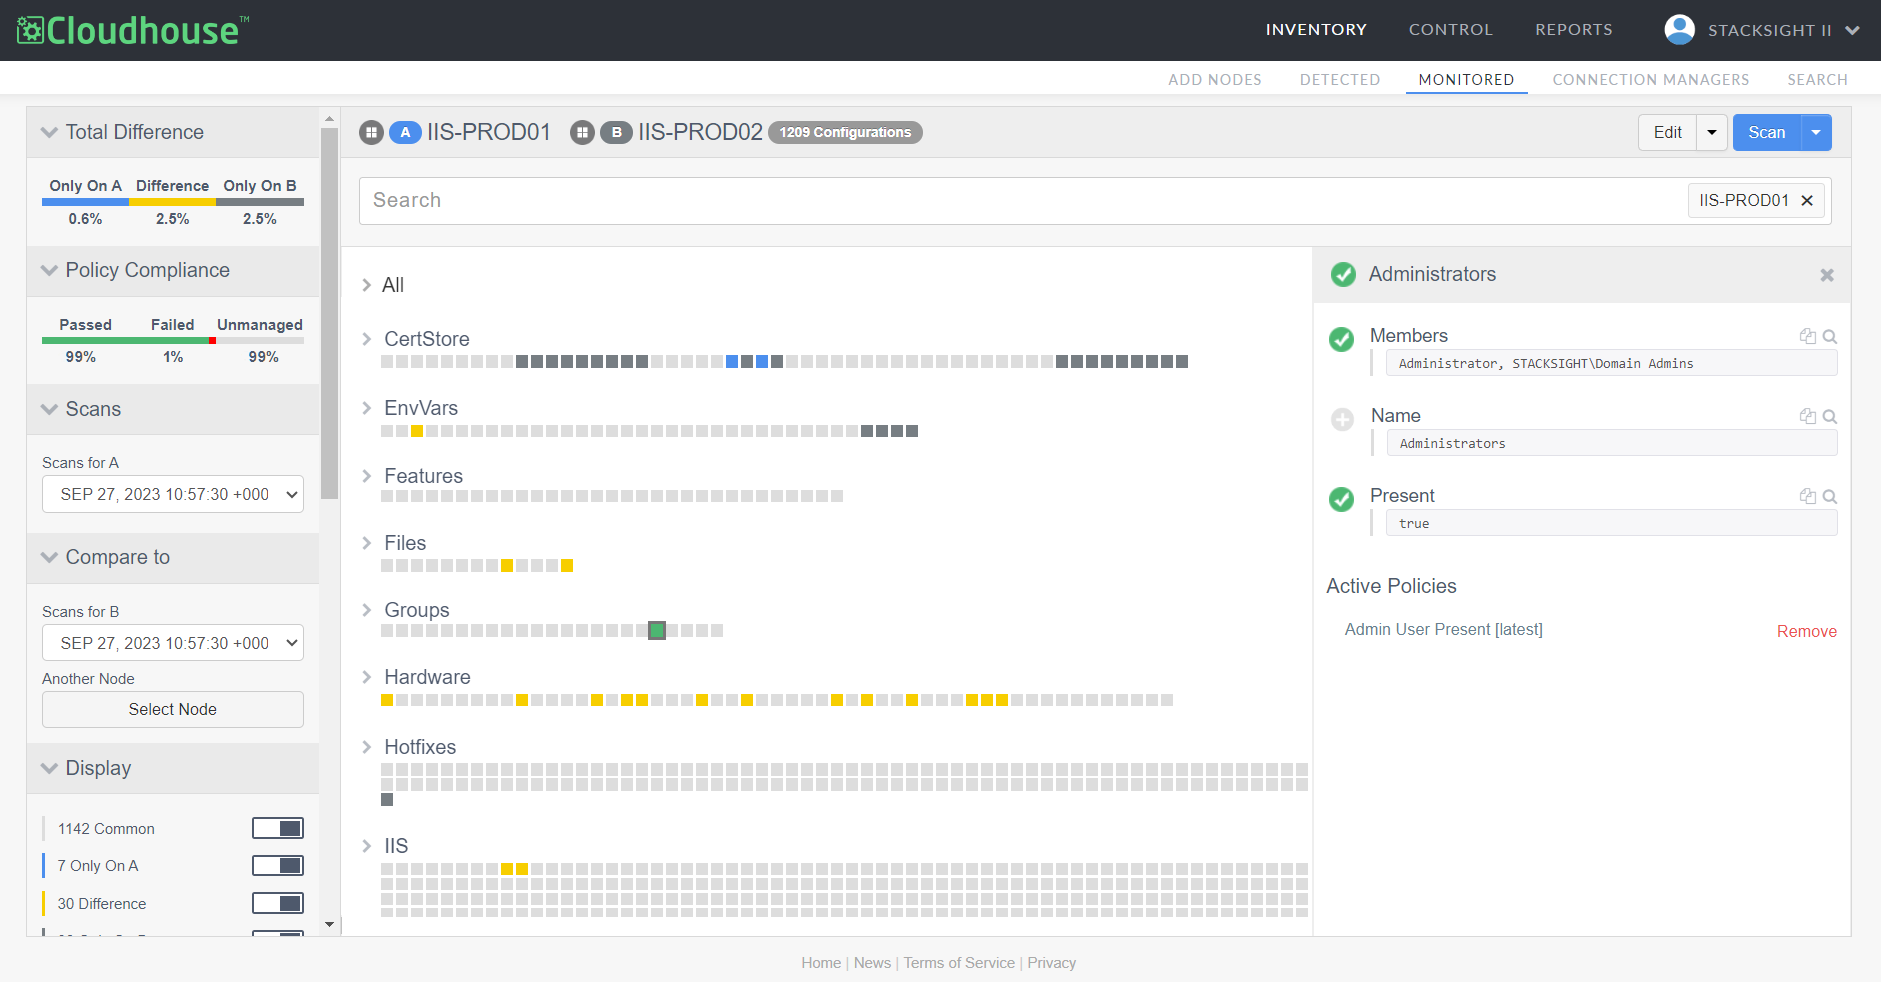
Policy Compliance
Policies are a series of checks that you can apply to a node during scanning to detect and uphold a desired state. For example, the 'Admin User Present' policy has been applied to both nodes in the example below, amongst others. This policy runs a check to ensure that the group 'Administrators' have the correct properties defined. The Policy Compliance drop-down menu divides the node configuration data into the following categories:
-
Passed (Green) – Configuration items with a policy check assigned that passed during the selected scan.
-
Failed (Red) – Configuration items with a policy check assigned that failed during the selected scan.
-
Unmanaged (Light Gray) – Configuration items with no policy check assigned. These are more commonly known as unmanaged nodes.
To view more information about a policy check, select one of the green or red configuration items to display the checks that were run, whether they were successful, as well as the policy that is applied. In the example below, we can see the results of the 'Admin User Present' policy check on one of the Groups configuration items. For more information on policies, see Policies.
Scans
By default, the most recent scan is displayed when a node is selected. However, the Scans drop-down menu contains a list of all the scans that have occurred on the selected node (node A). To access the scan results for a different date or time, select a scan from the drop-down list. See below for more information on how to select a different scan date for node B.
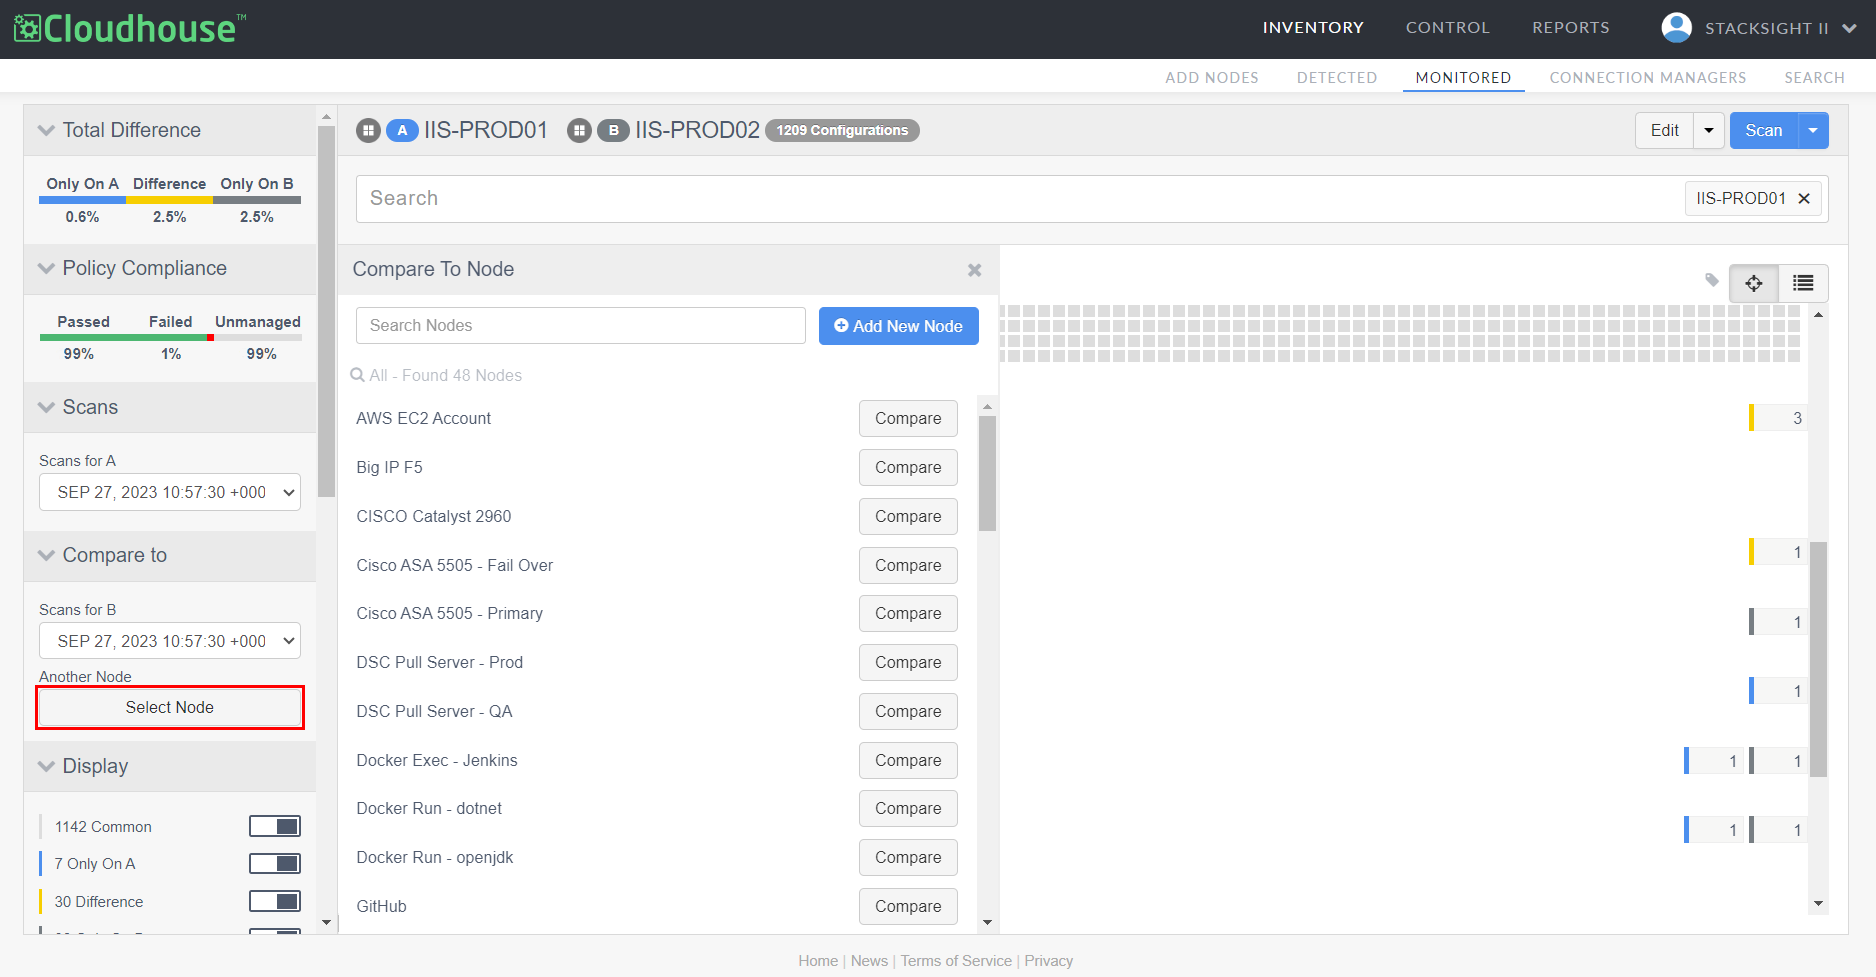
Compare To
The Compare To drop-down menu offers the ability to compare the results of node A's scan to another set of scan results. Here, you can select a different scan date for node B from the Scans for B drop-down list. The page automatically updates with the differences between the new scan results.
Alternatively, you can compare node A's scan results to the scan results of a different node, click Select Node to display the Compare To Node side panel. Here, you can search for a specific node, select a node from the list, or add a new node to compare to your existing node. Whatever node you select will replace node B in the difference report.
Note: If you click the Add New Node button, the Add Nodes page is displayed. Here, you can add a single node or add nodes in bulk, then return to this page to complete the differencing. For more information on how to add a node, see Add Nodes.
Display
With two nodes selected, you can filter the results of the two node scans according to the categories outlined in the Total Difference section, with the addition of the two following categories:
-
Common – Configuration items that are present on both nodes, with no differences.
-
Ignored Items – Configuration items that have been configured to be ignored within the node's scans and drift reports. For more information on how to configure your ignore list, see Node Scan Ignore Lists.
Switch the toggles on or off for the corresponding categories to filter the results of your node scans. For example, you could disable all Common configuration items, to only display the items that contain differences.
Policies
As described in the Policy Compliance section, policies are assigned to node groups to uphold a desired state of configuration. In the Policies drop-down menu, you can filter the Failed, Passed, and Unmanaged policies displayed within the difference report by switching the corresponding toggle on or off. In addition, each of the policies that are currently active and assigned to the selected node are displayed here. To access more information about a policy, select a policy from the list to view the Policy Details page, see Policies for more information.
Configuration Items
For each configuration item within the report, there is a set of corresponding settings that can be applied. To access a configuration item's settings, right-click on the square within the report.
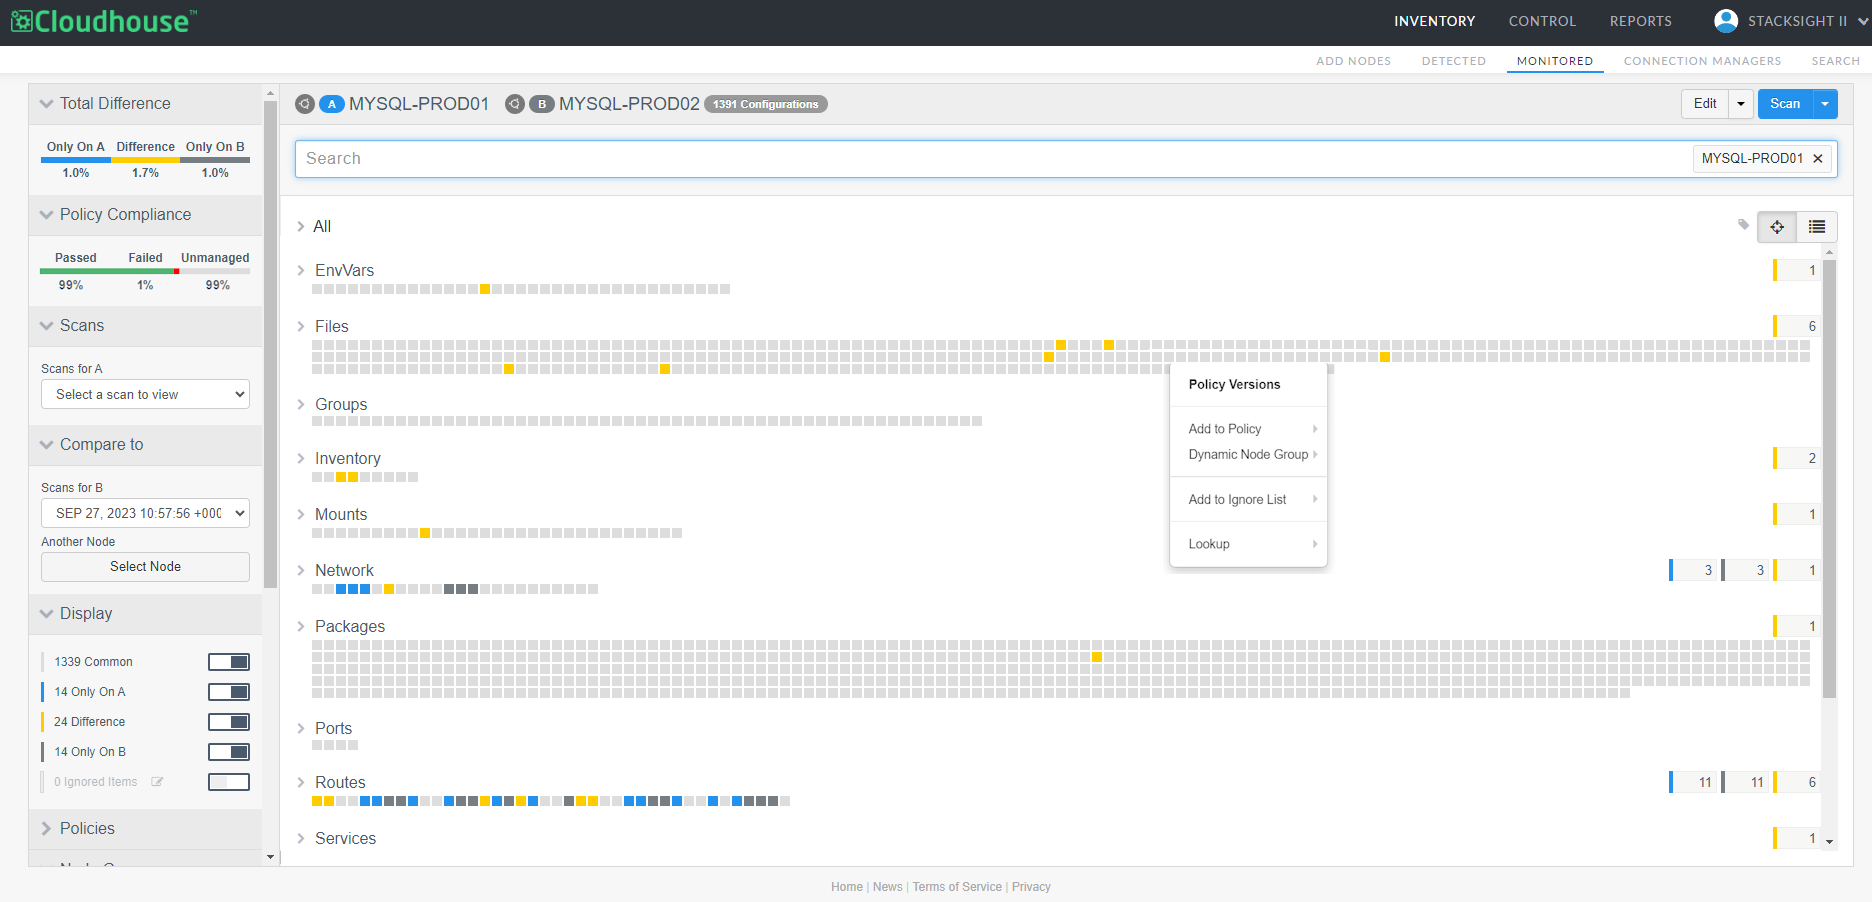
The following list of options is displayed:
-
Add to Policy – Create a policy from the selected scan of the configuration item to uphold the current state. For more information, see Policies.
-
Dynamic Node Group – Create a dynamic node group with a (dynamic group) query that automatically assigns any nodes that match the selected configuration item's value(s) to the group. For more information, see Dynamic Group Queries.
-
Add to Ignore List – Add the configuration item to the ignore list for the selected node's scans and drift reports. For more information, see Node Scan Ignore Lists.
-
Lookup – Search your default browser for the name of the configuration item you selected.
-
Add Scan Option – This option is only displayed for files. Add a file scan option for the selected configuration item. Select a node group from the list of options displayed to scan the raw contents of the file as part of the node group's regular scanning. The results of the file scan are then displayed within the configuration item itself. For more information on additional scan options that can be configured, see Scan Options.
Note: Alternatively, you can add a directory to be scanned within the node's group settings. For more information, see Edit Node Group.